SIMULATIONiQ™
On-Premises Enterprise Healthcare Simulation Software
EMS’s SIMULATIONiQ™ Enterprise is a comprehensive simulation audio-video capture, management, and skills assessment solution that streamlines the activities of mid-to large-size clinical simulation centers. In all, SIMULATIONiQ™ Enterprise is your one-stop on-premises simulation management solution.
Key Benefits of the SIMULATIONiQ™ Simulation Management Solution
- Internet Protocol (IP) and High Definition (HD) audio-video capture
- Immediate video playback and bookmarking for debriefing and research
- Checklist and rubrics, scoring, and statistical report generation
- Multiple simulator integration and capture of vital signs and events (may require additional hardware)
- Telemedicine simulation using integrated video conferencing (video conference license required)
- A distributed network linking various simulation resources through a central command center (optional)
- Automatic scheduling of rooms, participants, and simulators
- Dedicated on-premises solutions
- Support for COMLEX-USA Level 2-PE-style SOAP Note and USMLE-style Patient Note
- Integrated calendar view for SP and simulation events
- Student portfolio development to manage schedules, calendars, and activities
- Fully automatic paging announcements (optional)
- Simulated EHR (optional)
Download Now
Download Now
Drive Tangible Results with Comprehensive Simulation Management
As an educator, you face numerous challenges in integrating simulation training in healthcare into your overarching clinical education curriculum, like how to:
- Leverage automation to conduct high-impact debriefs with limited full-time resources
- Reliably measure and score learner progress
- Allow for system scalability for future program growth
- Cohesively integrate multiple streams of information into actionable data that drives decision-making
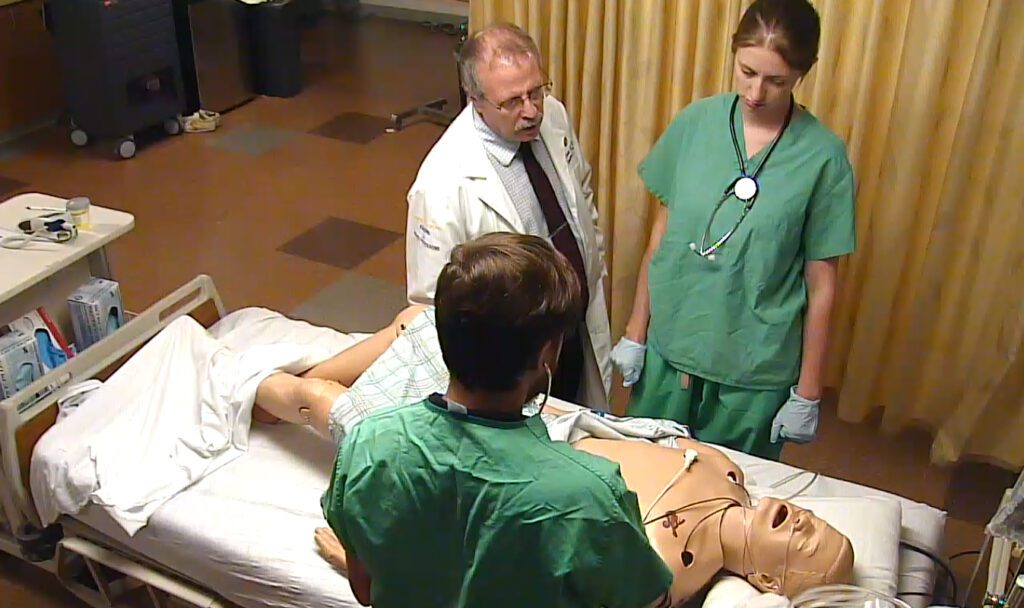
With our dedicated on-premises solutions, EMS’ SIMULATIONiQ™ Enterprise helps you overcome these challenges by providing a single easy to use integrated system with options for standardized patient (SP) and manikin-based simulation centers.
From audio-visual hardware and software, to debrief management software, to learner progression tracking capabilities, SIMULATIONiQ™ Enterprise enables evaluators to cost-effectively leverage their full simulation efforts to drive tangible results.
Schedule a Discussion
SIMULATIONiQ™ Enterprise | Smarter Simulation. Better Outcomes.™
SIMULATIONiQ™ Telemedicine Training and OSCE Workflows
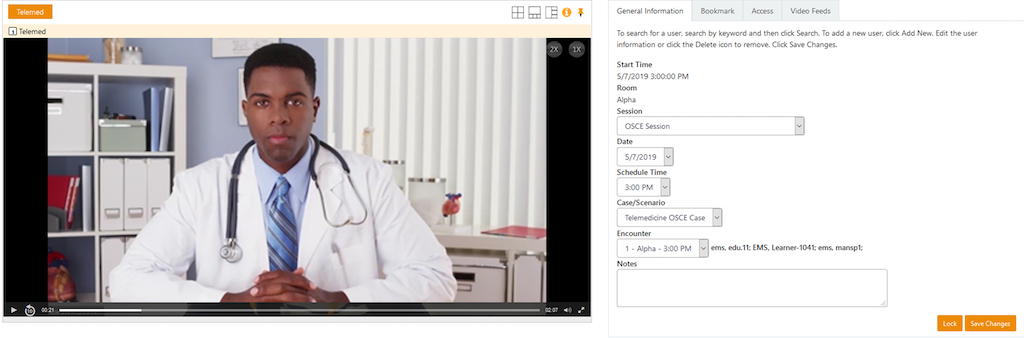
- Schedule simulated telemedicine between learners and SPs
- Facilitate remote, distance-based training with integrated video conferencing
- Set up physical and virtual rooms to support hybrid training scenarios
- Grant dedicated dashboard task access for learners
- Customize parameters specific to your program and facility requirements
- Easily create, organize, and manage training cases and workflows
- Add and assign SPs for training on specific cases
- Seamlessly debrief and review clinical decision making with learners online
Schedule a Discussion
Take charge of your programs and maximize efficiency
with seamless end-to-end simulation management.
Click the Button to Get Started